
The Daycare Multihomes Program (DCMP) looks after children of working mothers. They receive breakfast, lunch, and two snacks, covering 85% of the daily energy requirements Monday thru Friday. Groups of 30 children from each multihome were selected to study the effect of a nutritional supplementation with modified milk upon the nutritional status and development of the preschoolers. At one DCMP, in addition to their habitual feeding, the children (Group A) received 200 ml of a modified milk formula twice a day for 12 weeks. Another group (Group B) received the diet offered at the multihome. The children were evaluated at the beginning and at the end of the study. Weight and height were measured, laboratory tests were taken, 24 hour food intake recalls were performed, and psychological tests were performed for attention and recent memory assessment (Stanford-Binet Intelligence Scale and Weschler Preschool and Primary Scale of Intelligence WPPSI). Weight and height increased significantly (p<0.05) in Group A. Likewise, the laboratory mean values were higher (except for triglycerides), as well as the consumption and adequacy of calories, proteins, fats, carbohydrates, calcium, and iron (p<0.05). In a WPPSI arithmetic scale sub-test, which measures attention and concentration, Group A obtained better scores (p<0.05). The children supplemented with the milk formula improved their nutritional condition and obtained better scores in attention and concentration tests. However, the intervention was discontinued as the DCMP was interrupted in this location.
Palabras clave: children, food consumption, food supplement, laboratory tests, psychological tests, daycare centers, Venezuela.
El programa Multihogares de Cuidado Diario (MHCD) atiende a hijos de madres trabajadoras, reciben desayuno, almuerzo y dos meriendas que cubre el 85% de los requerimientos energéticos diarios de lunes a viernes. Para conocer el efecto de una suplementación nutricional con una leche modificada sobre el estado nutricional y el desarrollo de niños preescolares, se seleccionaron 30 niños en cada multihogar. En un MHCD los niños recibieron además de su alimentación habitual, 200 ml dos veces/día de una fórmula láctea modificada (Grupo A) por 12 semanas, el otro grupo recibió la dieta del multihogar (Grupo B). Los niños se evaluaron al inicio y al final del estudio. Se les tomaron las medidas de peso y talla, pruebas de laboratorio, un recordatorio de 24 horas para conocer la ingesta de alimentos y los test psicológicos para evaluar atención y memoria reciente (Stanfort Binet Inteligence Scale y Weschler Preeschool and Primary Scale of Intelligence WPPSI). El incremento en peso y talla fue significativo (p< 0,05) en el Grupo A. Igualmente fueron más altos, los valores promedios de laboratorio (excepto triglicéridos) y el consumo y adecuación de calorías, proteínas, grasas, carbohidratos, calcio y hierro (p< 0,05). En el subtest de la escala aritmética en WPPSI que mide atención y concentración, el Grupo A tuvo mejor respuesta (p< 0,05). Los niños que recibieron la fórmula láctea mejoraron su condición nutricional y las pruebas de atención y concentración. Sin embargo no fue posible continuar con la intervención debido a la suspensión del programa de MHCD en esta localidad.
Key words: niños, consumo de alimentos, suplementación, laboratorio, test psicológicos, Venezuela.
Nutritional Status and Development Preschoolers Daycare Multihomes Program
In 1990 the Government of Venezuela established the program of "MultiHogares de Cuidado Diario" (MHCD) MultiHome Daycare Centers, a National Day Care Program under the surveillance of the Ministry of the Family to help working mothers in their child care and also as a solution to improve the quality of the diets for Venezuelan children. The MHCD were part of a package of Social Programs devised by the Venezuelan Government to confront the socioeconomic unstableness since the decade of the eighties. In these centers the children were supposed to receive breakfast, lunch and two snacks in order to cover 85% of daily energy requirements. These programs were under the surveillance of the Ministry of the Family and in the nutritional part under the National Institute of Nutrition (Instituto Nacional de Nutrición INN). This Institute elaborated the menus, provided the food for preparation of the meals and had supervisors that evaluated the compliance with the program. There were two different kinds of settings: the "Hogar de Cuidado Diario" (Daily Care Home), where one or two mothers took care of 8 children and the "MultiHogar de Cuidado Diario" where 3 mothers and one facilitator cared for 30 children younger than 6 years of age in homes of the community located in poor neighborhood areas of the city2.
In 1998, the MHCD program assisted 42% of children younger than 6 years living in poverty3, whose mothers worked outside their homes. The program had been evaluated over the years, specially in the aspects of budget and coverage although the health and nutritional aspects had also been considered 4-8. Some studies had found irregularity in the distribution and in the availability of food to prepare the meals and as a consequence, unfulfillment of the programmed menus. Also, others have reported low educational level, lack of proper hygiene, low efficiency and creativity in the caregivers that ultimately affected the preparation of meals9. On the other hand one study performed in Daycare Centers (MHCD) of Antímano in 1999, found 61% satisfaction of parents with the food and nutrition services of their Childcare centers10. We wanted to study in two MHCD, the effect of a nutritional supplementation with modified and enriched milk formula upon the nutritional state and development of the group of children younger than 6 years of age that attended these centers. We evaluated anthropometric parameters, basic laboratory test and some measures of attention and short term memory processes.
the coverage of the program by evaluating the adequacy of the food consumed to cover daily requirements
The study design was of the descriptive type and also comparative.
All children 1 to 6 years of age that assisted the two Daycare Centers ("Pasito a Pasito", in El Valle and "Marcelino Pan y Vino", in Caricuao) of the National Program of Multihogares de Cuidado Diario in the Metropolitan Area of Caracas, were included.
In these day care centers, children of working mothers were received between 7 am to 5 pm from Monday through Friday. They ate their breakfast, the midday meal and two snacks (except Saturday and Sunday) and they took their evening meal at home. The menus served at the day care centers had been devised by the National Institute of Nutrition of Venezuela and were calculated to provide 85% of the daily requirements. Meals served at the centers were identical for all children irrespective of age. The children had their activities, played, and received education in table manners and habits of personal hygiene. They had one or two naps during the day according to their age.
There were 30 children in each center. All children going to each of the centers were included.
There were no selection criteria except for the absence of disease, the regularity of assistance and the consent of the parents. The parents of each center were invited to a meeting where they were explained the nature of the study and signed a written consent form agreeing to participate.
A pediatrician performed a medical history and a full-physical exam in all children. The medical history included personal and family antecedents, record of food intolerance, allergy, medications or vitamins currently taken, recent hospitalizations and illnesses. Besides the frequency of cavities (12/60), there were no major medical problems. One child had a history of asthma and one 4 11/12 years of age had a heart operation (ductus arteriosus) at two years of age, but fully recovered at the moment of the study.
The centers were of low to low middle class level and they were situated in similar low income sections of the city.
The two MHCD were chosen because they were convenient and accessible to the group of University students that were to be responsible for the gathering of the data. This team of Nutrition students of the last semester (10th) of the School of Nutrition of the Central University of Venezuela, visited the MHCDs daily to supervise the meals, record the assistance and consumption. There were three students in one MHCD and 4 in the other.
The children in one center (Group A) received also a modified milk product and the children in the other did not (Group B), they received habitual diet. We did not randomize the children in both day care centers because ethical concerns generally forbid the feeding of some children in a class and not of the other children within the same class, and we assigned all children in one center to receive the milk and the children on the other as Group B. Initially, we intended a cross-over design, where the groups B and A changed at the end, but the study coincided with the change in Government and the new government policies ended the MHCD program. For this reason in the last month of the study, although the children continued to assist the multihogar, the supply of food from the National Institute of Nutrition finished and the parents had to help in the provision of the food from home for their children until the centers closed definitively. This produced important differences in the availability of food by the children and in general the total amount decreased.
The Group A attended the MHCD "Pasito a Pasito" in El Valle, a neighborhood of Caracas. They received their regular meals and twice a day a glass (200 ml) of modified milk formula. The preparation of the milk was done by the personnel of the MHCD following the instructions that were written in clear and easy form in a poster inside the preparation kitchen. The Nutrition students supervised this procedure and also the consumption of the milk by the children. The amount of milk consumed each day by each child was recorded.
The 400 ml of the milk formula preparation provided 400 calories, 12.8 g of protein, 14 g of fat (blend of vegetable oils), and 58 g of Carbohydrate; Vitamin A: 666 IU; Vitamin D: 200 IU; Vitamin E: 5 IU; Vitamin C: 48 mg: Vitamin K: 12 mcg; Thiamine: 0.36 mg; Riboflavine: 0.64 mg; Folic Acid: 20 mg; Vitamin B6: 0.40 mg; Vitamin B12: 0.84 mg; Niacine: 4.6 mg; Panthotenic Acid: 1.2 mg; Biotine: 1.2 mcg; Calcium: 400 mg; Phosphorus: 320 mg; Iron: 5 mg; Magnesium: 40 mg; Zinc: 4 mg; Iodine: 76 mcg; Manganese: 0.52 mg; Copper: 0.18 mg; Sodium: 188 mg; Potassium: 600 mg; Chloride: 440 mg.
The Group B was in the MHCD "Marcelino Pan y Vino" in Caricuao in a similar socio-economic area of the city. No milk supplement was given in this group.
At the beginning and at the end the children were studied by Anthropometry, Laboratory test, Food Consumption and Food Adequacy and also underwent some tests to evaluate short term memory and attention.
The nutritional state was determined by anthropometry using weight (W) in Kilograms, grams (Kg, g); height (H) registered in centimeters (cm), arm circumference in centimeters and millimeters (cm, mm), and triceps skin-fold in millimeters (mm). From these data nutritional anthropometric values were obtained as Weight for Age; Height for Age, Weight for Height, the location in the percentile of the National Tables, Body Mass Index and a Nutritional Diagnosis11..
The 50% percentiles for weight and height for Venezuelan preschool children were obtained from FAO-WHO-INN tables.
At the beginning and at the end of the study all children were measured wearing only underwear and without shoes, in the morning, as they arrived at MHCD. Standard pediatric scales at the MHCD were used to weigh the children. The anthropometric data was collected by the team of Nutrition students that had been previously trained and standardized in anthropometric techniques.
Blood samples were taken in both groups after an overnight fast by a lab technician trained in the extraction of blood in children, to evaluate: Complete Blood Count (CBC), Glycemia, Cholesterol, Triglycerides, Total Protein, Albumin, Serum Iron and Ferritin.
The samples were processed the same day in the Unit of Clinical Chemistry and Drug Detection of the Institute of Experimental Medicine of the Central University of Venezuela (UCV) in Caracas.
To measure food consumption, the 24 hour recall technique and the direct weighing method were used.
The direct weighing method consisted of weighing the food and measuring the liquids served and the ones not consumed in the Multihogar. To measure consumption of foods in the MHCD two trays were taken randomly, weighed before and after meals. This was carried-out by the team of Nutrition students at each center.
The 24 hour recall was used to learn about consumption at home during weekends and at nights. A special form was elaborated to help mothers report all foods and drinks consumed at home during a week-end and at the evening meal the night before the day that the food intake at the MHCD was to be recorded. This form had been previously validated in the School of Nutrition. Foods were converted into energy and nutrients using the Food Composition Tables of the National Institute of Nutrition. The Nutrition software program used to calculate consumption was the CERES Program, version 1.02, FAO 1997, which includes the food consumption tables for the Venezuelan population12. Observed intakes were then compared to the Recommended Intakes as published by the National Institute of Nutrition in 1993 (new revision march 2000) in order to determine the adequacy of the diets.
Two different instruments of evaluation according to the age of the child were used:
The ¨Weschler Preschool and Primary Scale of Intelligence (WPPSI)" for children between 3 years and 10 months up to 6 years of age and the Stanford Binet Intelligence Scale for children between 2 years and 3 years and 10 months of age. The cut-off point was chosen because the age 3 years and 10 months is the minimal age at which the WPPSI could be applied.
These two scales were chosen because they have standardized items that measure the processes that we wanted to evaluate (attention and short term memory).
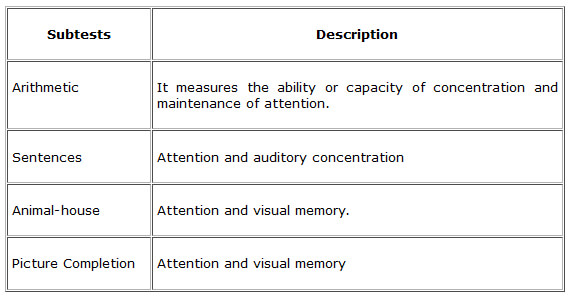
Four subtests of the WPPSI scale that are significantly correlated with attention and short term memory were chosen. These were:
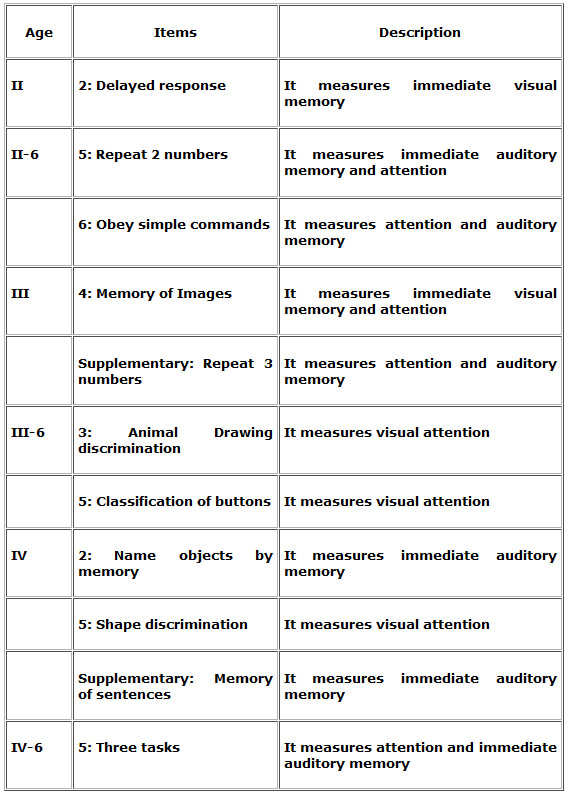
In the younger children the items used were the ones that are related to attention and short-term memory for the different ages of the Stanford Binet Intelligence Scale, such as:
The data were compared and a combined index of the 4 sub-tests of the WPPSI was obtained comparing the A and B groups.
Every subtest was also compared separately between the data of the two groups. Tests of independence and a correlation using chi- square were applied.
In the WPPSI it was taken as a norm an X= 10 and a SD= 3. It was taken as a significant difference between pre and post treatment an SD ≥ 1.5.
In the Stanford Binet, which is based in X= 100 and SD = 15. It was taken as a significant difference between pre and post treatment an SD ≥ 7.5. In this test, an index of attention and memory was calculated and it was correlated with the age appropriate tables according to the chronological age of each child.
The maturation variable between pre and post test periods (12 weeks) was controlled because the norms used and applied were based in the chronological age at the exact moment of the application of the test.
The children were evaluated at the beginning and at the end of the study period (12 weeks interval) by the two child psychologists one specialized in children younger than 3 years and the other in older children.
Descriptive analysis was accomplished using central tendency and dispersion measures. The associations of interest were examined by chi-square (X2), Paired "t" test.
The Statistical Analysis of the 2,352 data originally obtained were analyzed using Microsoft ® Excel 97 and the statistical package SPSS®; Version 9.0 for Windows.
The results were validated using three different tests. Students test (Comparison of means), "t" test comparison of two samples with different variances, Pearsons correlation (correlation between the comparison of two means) and Z score (to value if the data was distributed normally). Finally a Prognostic test was applied to find the reproducibility under the same circumstances.
The study lasted from February 18th to May 8th 2000, a total of 81 days, 12 weeks.
Of the 60 children that started the study only 20 in each group remained for the final analysis. There was high mobility in these families and 3 children in the Group A and 5 in the Group B moved to other parts of the city. In the Group B, in 3 children we were not able to obtain the final laboratory sample. In the Group A, 8 children drank less than 4 glasses of modified milk formula during the week, and for this reason they were excluded from the calculations. Finally in 2 children of each group their anthropometric values were out of range and skewed the data, for example in one case one child grew 7 cm in the 81 days of the study, or some gained or lost weight more than 150 g/d which could not be real. For these reason these children were not included in the final calculations.
The forty children that had the data completed were distributed by sex as follows: 19 males (47.5%) and 21 females (52.5%), distributed by age as follows: 2 (5%), one year to one year and eleven months; 7 (17.5%), two years to two years and eleven months; 13 (32.5%) three years to three years and eleven months; 7 (17.5%) four years to four and eleven months and 11 (27.5%) five and five years and eleven months.
AGE
GROUP A
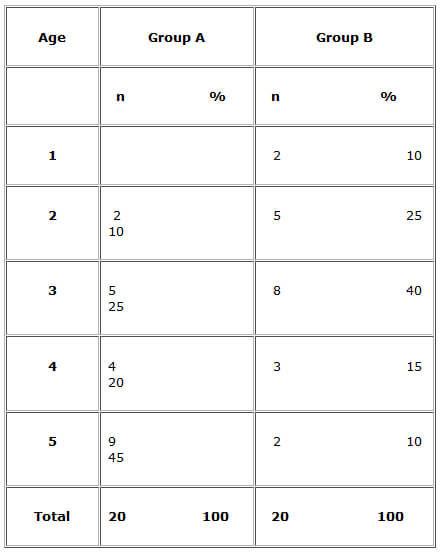
Of the 20 children remaining in the Group A the distribution by age are given in Table 1. The average age at the beginning of the study was 4.05 ± 1.08 years.
GROUP B
Of the 20 children in the Group B the distribution by age are given in Table 1. The average age at the beginning of the study was 2.95 ± 1.10 years.
ANTHROPOMETRY
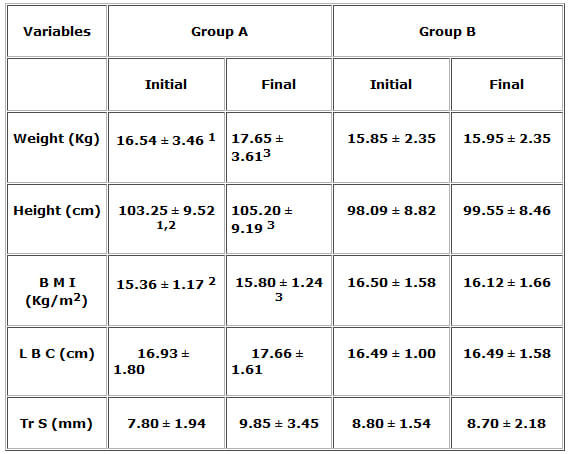
The anthropometric data for the initial and final samples of both groups are given in Table 2 and 3.
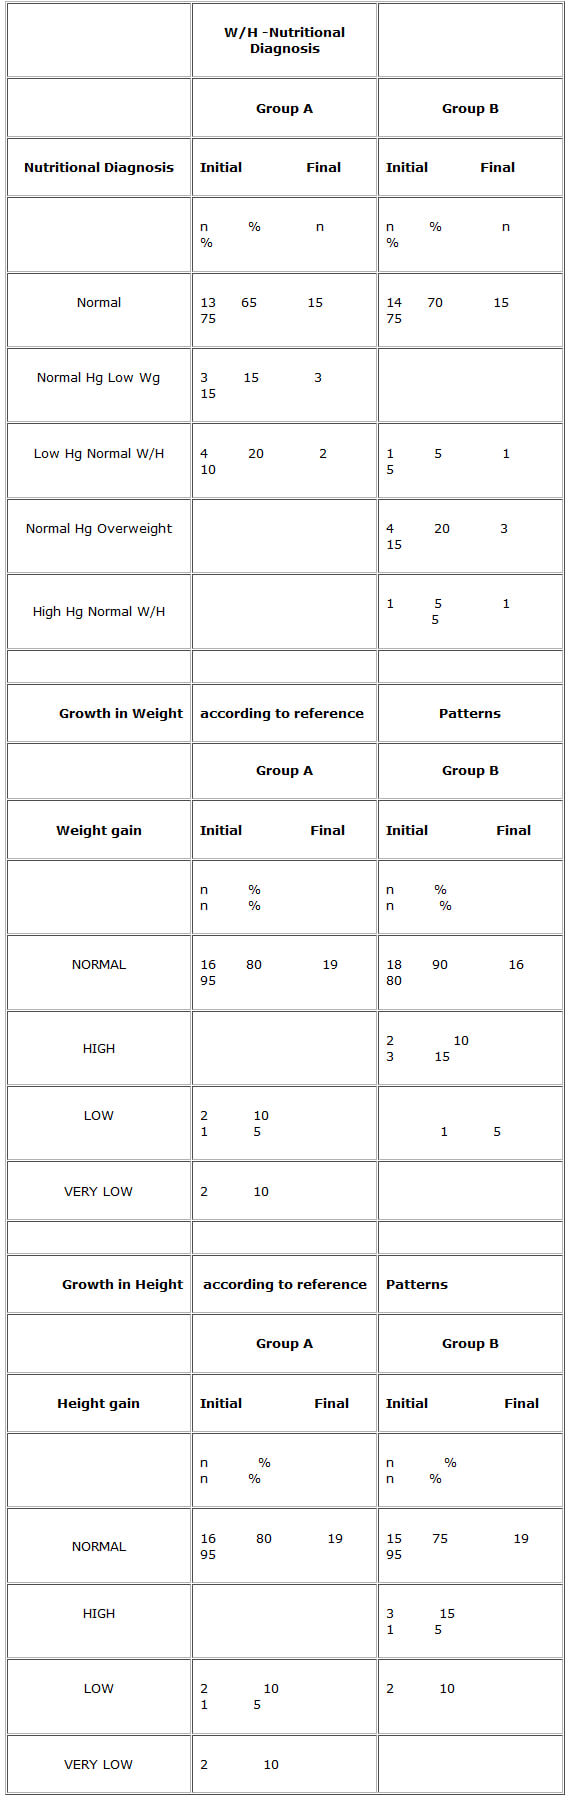
In the Group A 13 individuals were above average weight while 7 were below it.
At the end, 6 individuals were above the average weight. All children in the Group A gained weight during the study period.
The average gain in g/day was 13.70±6.15. Six children showed an increment in weight between 18 and 24 g/day. A prognostic test was applied to find the reproducibility under the same circumstances, and the result was slightly below 13.70 g/day at 12.79 g/day (93.75%), which validates the average weight gain obtained in the Group A.
In the Group B, 10 individuals were above average weight. At the end, 15 individuals were above average weight. During the study period only 5 children gained weight, 4 lost and 11 remained the same. The average gain in g/day was 1.23±14.39.
In the Group A, 10 individuals were above average height while 10 were below it.
At the end, 10 individuals were above average height. The average gain in height was 1.95±0.76 cm.
In the Group B, 10 individuals were above average height. At the end, 9 individuals were above average height. The average gain in height was 1.46±1.08 cm.
In the Group B the Pearsons test showed high correlation for Weight and Height with a Confidence Intervals of 95% and a statistical significance of <0.05.
In the Groups A and B, there was no significant difference between the values at the beginning and at the end.
In the Groups A and B, there was no significant difference between the values at the beginning and at the end.
In the Groups A and B, there was no significant difference between the values at the beginning and at the end.
At the beginning of the study there was no significant difference in the weight values of the groups A and B. There was a statistically significant difference in height and BMI at the beginning of the study.
At the end there were significant differences in weight, height and BMI between the Groups A and B.
The laboratory data for the initial and final samples of the Groups A and B are given in Table 4.
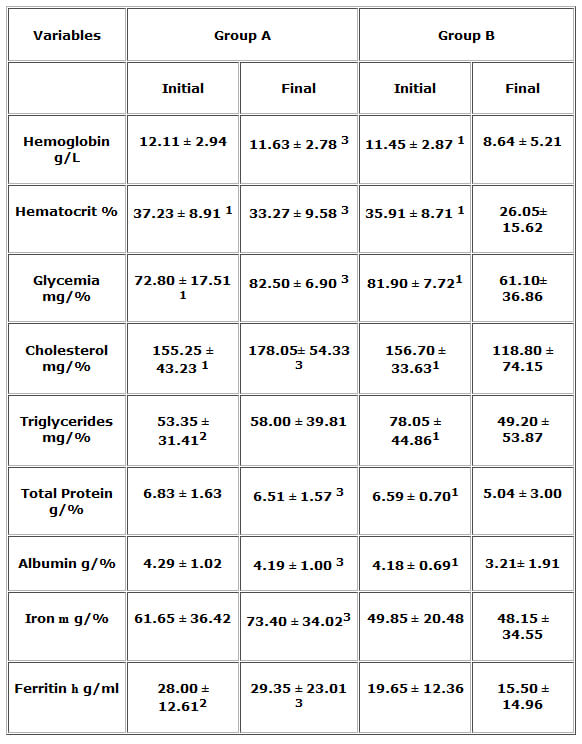
There were no significant differences between the Groups A and B in the initial laboratory values for Hemoglobin, Hematocrit, Glycemia, Cholesterol, Protein, Albumin, or Iron. There was a statistically significant difference (p<0.05) for the values of Triglycerides and Ferritin between the two groups at the beginning of the study.
There were significant differences between the Groups A and B in the final laboratory values in all parameters except Triglycerides.
At the beginning of the study the food provided by the MHCD covered 84.21% of the daily requirement in the Group A and 97.82% in the Group B. At the end the Group A received 121.93 % (modified milk formula included) of the daily requirements while the Group B took 55.91%.
The average consumption of modified milk formula was 345.34±33.36 ml/day per child in the Group A.
Ten children took the 2 glasses of milk daily (10 glasses/week), 7 took 8 glasses /week, 3 took 6 glasses a week. Eight children drank less than 4 glasses of milk during the week and for this reason they were excluded from the calculations.
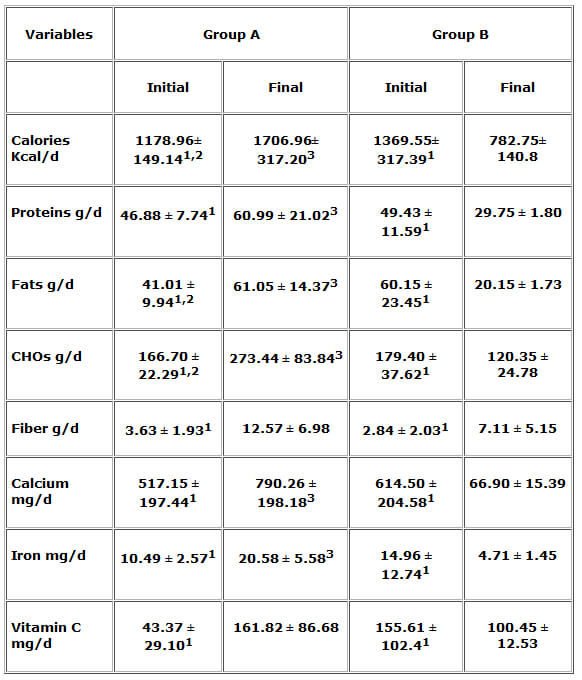
The food consumption data for the initial and final samples of the Group A are given in short in Table 5. There were higher values at the end. There were significant differences between the values at the beginning and at the end in all the parameters: Calories, Proteins, Fats, Carbohydrates, Calcium, Iron, Vitamin C.
In the Group A the average values food adequacy were: Calories: 96.06±16.18 % adequacy at the beginning and 139.02±30.27 % at the end. Proteins: 114.06±26.67 % adequacy at the beginning and 147.50±53.82 % at the end. Fats: 30.14±8.19 % of total caloric requirement at the beginning and 44.79±11.62 % at the end. Carbohydrates: 54.50±10.55 % of total caloric requirement at the beginning and 35.36±13.03 % at the end. Fiber: 45.39±24.14 % adequacy at the beginning and 157.11±87.21 % at the end. Calcium: 84.85±44.21 % adequacy at the beginning and 127.39±49.61 % at the end. Iron: 79.30±20.07 % adequacy at the beginning and 155.96±45.18 % at the end. Vitamin C: 100.71±68.52 % of adequacy at the beginning and 369.86±191.23 % at the end.
In the Group B the average values for food consumption are given in short in Table Nº5. There were lower values at the end. There were significant differences between the values at the beginning and at the end in all the parameters: Calories, Proteins, Fats, Carbohydrates, Calcium, Iron, Vitamin C.
In the Group B the average values food adequacy were: Calories: 121.75±31.55 % adequacy at the beginning and 69.28±12.13 % at the end. Proteins: 134.23±41.61 % adequacy at the beginning and 79.96±10.11 % at the end. Fats: 48.55±21.08 % of total caloric requirement at the beginning and 16.09±1.72 % at the end. Carbohydrates: 33.78±23.98 % of total caloric requirement at the beginning and 73.34±2.56 % at the end. Fiber: 35.44±25.42 % adequacy at the beginning and 88.88±64.41 % at the end. Calcium: 117.97±38.69 % adequacy at the beginning and 13.03±3.44 % at the end. Iron: 120.23±106.89 % adequacy at the beginning and 37.26±10.35 % at the end. Vitamin C: 381.28±257.49 % of adequacy at the beginning and 242.42±29.32 % at the end.
In the comparison between the two groups there were significant differences in calories, fats, carbohydrates, and calcium, at the beginning.
In the comparison between the two groups at the end there were significant differences in calories, proteins, fats, carbohydrates, calcium, and iron.
There were 25 children in the Group A and 22 in the Group B.
The four subtests of the WPPSI scale were given to the older children: 16 in the Group A and 10 in the Group B.
The Stanford Binet was applied to 9 children in the Group A and 12 in the Group B.
A combined index (Attention-Memory Index= AMI) of the 4 sub-tests of the WPPSI was obtained, and in the Group A, 3 children showed an improvement, 12 did not show any change and 1 showed worsening; in the Group B 2 improved, 4 worsened and 4 remain the same. A similar index of attention and memory was calculated in the children that received the Stanford Binet tests and it was correlated with the age appropriate tables according to the chronological age of each child. In the Group A 4 children showed an improvement, 2 did not show any change and 3 showed worsening. In the Group B 4 improved, 3 worsened and 5 remain the same. In total in the Group A 7 improved, 14 did not show change and 4 worsened. In the Group B 6 improved, 6 worsened and 10 remain the same. When the Chi-Square (χ²) test was applied it showed no statistical differences between the two groups in the combined index.
When the data obtained in every subtest of the WPPSI were compared separately between the Groups A and B, the results were as follows:
In the Group A there were 16 children: 6 improved, 8 did not change and 2 worsened, in the Group B there were 10 children of which none improved, 5 did not change and 5 worsened. There was a significant difference in favor of the Group A when the Chi-Square (χ²) test was applied.
In the Group A 6 improved, 9 did not change and 1 worsened. In the Group B 2 improved, 6 did not change and 2 worsened. There was no difference between the groups when the Chi-Square (χ²) test was applied.
In the Group A 3 improved, 9 did not change and 4 worsened. In the Group B 5 improved, 4 did not change and 1 worsened. There was no difference between the groups when the Chi-Square (χ²) test was applied.
In the Group A 5 improved, 9 did not change and 2 worsened. In the Group B none improved, 6 did not change and 4 worsened. There was no difference between the groups when the Chi-Square (χ²) test was applied.
The food provided by the MHCD in both centers, covered more than expected at the beginning of the study (98% in the Group B and 84% in the Group A). At the end, the closing of the program for the lack of Government funding, reduced in such a way the availability of foods that the coverage was reduced to 56% in the Group B. This showed the importance of the program to cover the daily needs of these children living below the poverty level. Initially the program was started to improve the quantity and quality of the food in the lower class children and without any apparent reason was suddenly ended. In the children of the MHCD Group B, this measure proved harmful for their nutrition and growth. The Group A was in someway protected by the consumption of the modified milk formula and the coverage was 122 %.
These differences in food consumption were reflected in the anthropometry and in the laboratory values; the Group A showed better weight and height gain. In the Group B the value for Hemoglobin, Hematocrit, Glycemia, Cholesterol, Triglycerides, Total Protein and Albumin decline during the study period.
In the psychological tests the only significant finding was in a subtest of the WPPSI scale in arithmetic, that measures attention and concentration, and we found a significant difference in favor of the Group A. This could be a fortuitous finding but it has also been found in school feeding studies done elsewhere. In Jamaica a study done in school children on the effect of breakfast on cognition found that the alleviation of hunger during school hours was a valid reason for the improvement in arithmetic, in their case the improvement in arithmetic was not related to weight gain or biochemical variables.13
This study showed that when the program was stopped and the food consumption decreased, the children in he Group B, deteriorated in the anthropometric and laboratory values.
On the other hand the Group A continued to grow normally probably due to the protective effect of the added calories and nutrients of the modified milk formula preparation. This measure helped the children of this group to avoid the condition of malnutrition that the other children had to face. The Group A showed better response in at least one of the psychological subtests that measured concentration and attention.
It is very impressive that in this a short time there was such a significant deterioration in the hematologic values of the children in the Group B. It is well known that the deficiency of certain nutrients at these early ages may have deleterious effects for life. For example, an iron deficiency anemia may contribute to impaired physical growth and cognitive development, that not only affect at the present moment but may have measurable effects for life14-18. In the area of cognition, improving general nutrition, even for short periods of time may have lasting influences in learning and behavior19.
At the same time the study showed that the simple intervention of the modified milk formula preparation was enough to abort the deterioration suffered by the children in the Group B, and it could be proposed as a provisional solution to preserve the children while another program or solution appears.
*We would like to thank the Nutrition students: Aguilar Ruth, Alfonso Kerlyn, Bencomo Carolina, Campos Mariana, González Carmen, Manzanillo Carmen J, Vázquez Desireé, who collaborated in this study, and Wyeth for to supply the modified milk formula ProgressÒ .